
Property type
Monthly market update
Rutland Park real estate market report.
See the latest available Rutland Park benchmark prices, listings, sales, absorption and days on market—then talk through what the numbers mean for the home you are considering.
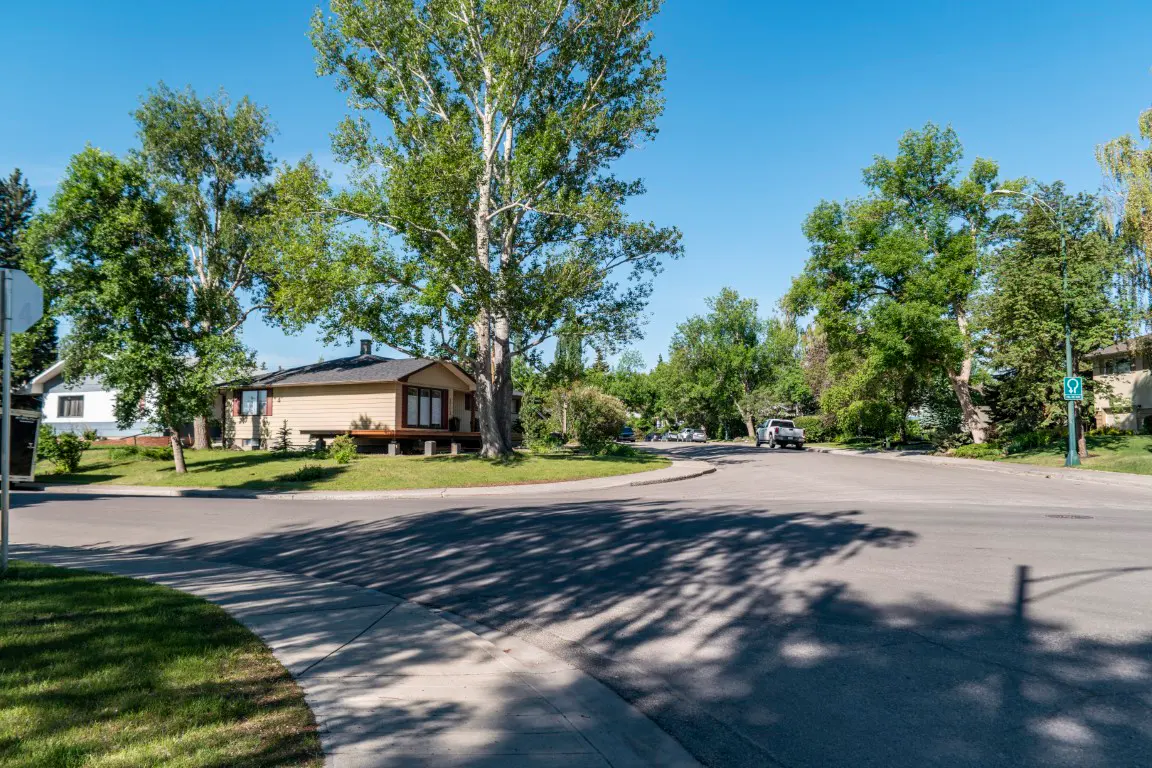
Monthly market snapshot
Rutland Park · August 2026
See Rutland Park benchmark prices, active and sold listings, absorption and average days on market by property type for August 2026. A blank simply means that field was not reported for that segment.
Report statusLatest available reportReal Info Box Inc.
Rutland ParkMarket reportReal Estate Partners · Real Broker
Reporting periodAugust 2026Community report · no estimates
01Market statusAbsorption-rate view
Property type
Semi-detached
Property type
Row
Property type
Apartment
02Benchmark priceBy property type
Month to monthDown 4.86%
Year to yearUp 2%
Month to monthNot reported in supplied file
Year to yearNot reported in supplied file
Month to monthDown 1.2%
Year to yearDown 3%
Month to monthNot reported in supplied file
Year to yearNot reported in supplied file
03Active & sold listingsPlus average days on market
Detached
Active3August 2026
Sold1August 2026
ADOM43days
Semi-detached
Active—not reported
Sold—not reported
ADOM—not reported
Row
Active—not reported
Sold—not reported
ADOM—not reported
Apartment
Active—not reported
Sold—not reported
ADOM—not reported
| Property type | Benchmark | Absorption | Active | Sold | ADOM |
|---|---|---|---|---|---|
| Detached | $1,024,700 | 33% | 3 | 1 | 43 |
| Semi-detached | Not reported | Not reported | Not reported | Not reported | Not reported |
| Row | $369,000 | Not reported | Not reported | Not reported | Not reported |
| Apartment | Not reported | Not reported | Not reported | Not reported | Not reported |
Source: Real Info Box Inc. Values transcribed from the client-supplied Rutland Park Complete Report — August 2026; information is deemed reliable but not guaranteed. Community statistics are not a property valuation.
Monthly report archive
Follow the Rutland Park market over time.
Open any month to see the property-type figures reported for that period. New reports are added without erasing the earlier record.
Turn the Rutland Park numbers into a better property decision.
Compare the same kind of home
Detached, semi-detached, row and apartment markets can move differently. Start with the segment that matches the property. For Rutland Park, keep established detached housing in the same decision as inner-city routes and services. Nearby alternatives in the same decision can include Lincoln Park and Currie Barracks.
Look at supply and sales together
Active listings show the available competition; sales and absorption show how buyers are moving through it. A few transactions can move a percentage sharply. For Rutland Park, keep renovated and substantially updated homes in the same decision as neighbourhood parks and gathering places. Nearby alternatives in the same decision can include Currie Barracks and Glamorgan.
Bring the numbers back to the address
The community trend is context, while lot position, effective age, renovations, condition, finish and current alternatives shape one home. For Rutland Park, keep attached or infill options in the same decision as multiple commuting options. Nearby alternatives in the same decision can include Glamorgan and Richmond.
A quick guide to the monthly measures.
Benchmark price
A modelled reference for a defined property type and geography—not the expected sale price of a specific home. For Rutland Park, keep established detached housing in the same decision as inner-city routes and services. Nearby alternatives in the same decision can include Lincoln Park and Currie Barracks.
Active listings
Properties reported active under the source rules at the period cut-off. Current status still requires the live listing source. For Rutland Park, keep renovated and substantially updated homes in the same decision as neighbourhood parks and gathering places. Nearby alternatives in the same decision can include Currie Barracks and Glamorgan.
Sales
Transactions counted by the licensed report definition for the named period, geography and property form. For Rutland Park, keep attached or infill options in the same decision as multiple commuting options. Nearby alternatives in the same decision can include Glamorgan and Richmond.
Absorption rate
A supply-and-sales relationship whose calculation, period and denominator must be understood before assigning a market label. For Rutland Park, keep different lot and redevelopment contexts in the same decision as a street-by-street residential experience. Nearby alternatives in the same decision can include Richmond and Lincoln Park.
ADOM
Average days on market under the source methodology. It describes the reported set, not a guaranteed marketing time. For Rutland Park, keep established detached housing in the same decision as inner-city routes and services. Nearby alternatives in the same decision can include Lincoln Park and Currie Barracks.
Current Rutland Park homes
See current Rutland Park homes for sale
Browse the dedicated HomesForSaleNearMe community search, then bring a specific address back to Dusko and the team for status confirmation and a property-level review.
Monthly updates
Get the next Rutland Park report.
Receive the new market snapshot and ask Dusko how the latest supply and sales compare with a specific property.
Turn the Rutland Park numbers into a better property decision.
Compare the same kind of home
Detached, semi-detached, row and apartment markets can move differently. Start with the segment that matches the property. For Rutland Park, keep established detached housing in the same decision as inner-city routes and services. Nearby alternatives in the same decision can include Lincoln Park and Currie Barracks.
Look at supply and sales together
Active listings show the available competition; sales and absorption show how buyers are moving through it. A few transactions can move a percentage sharply. For Rutland Park, keep renovated and substantially updated homes in the same decision as neighbourhood parks and gathering places. Nearby alternatives in the same decision can include Currie Barracks and Glamorgan.
Bring the numbers back to the address
The community trend is context, while lot position, effective age, renovations, condition, finish and current alternatives shape one home. For Rutland Park, keep attached or infill options in the same decision as multiple commuting options. Nearby alternatives in the same decision can include Glamorgan and Richmond.
A quick guide to the monthly measures.
Benchmark price
A modelled reference for a defined property type and geography—not the expected sale price of a specific home. For Rutland Park, keep established detached housing in the same decision as inner-city routes and services. Nearby alternatives in the same decision can include Lincoln Park and Currie Barracks.
Active listings
Properties reported active under the source rules at the period cut-off. Current status still requires the live listing source. For Rutland Park, keep renovated and substantially updated homes in the same decision as neighbourhood parks and gathering places. Nearby alternatives in the same decision can include Currie Barracks and Glamorgan.
Sales
Transactions counted by the licensed report definition for the named period, geography and property form. For Rutland Park, keep attached or infill options in the same decision as multiple commuting options. Nearby alternatives in the same decision can include Glamorgan and Richmond.
Absorption rate
A supply-and-sales relationship whose calculation, period and denominator must be understood before assigning a market label. For Rutland Park, keep different lot and redevelopment contexts in the same decision as a street-by-street residential experience. Nearby alternatives in the same decision can include Richmond and Lincoln Park.
ADOM
Average days on market under the source methodology. It describes the reported set, not a guaranteed marketing time. For Rutland Park, keep established detached housing in the same decision as inner-city routes and services. Nearby alternatives in the same decision can include Lincoln Park and Currie Barracks.
Local market-reading record
Eight Rutland Park checks behind the monthly series.
Rutland Park is an inner-city market where established housing, renovation and redevelopment can create distinct comparison sets on neighbouring streets. This record turns the community file into route-specific work while keeping the subject property and current professional advice separate.
Open the monthly market reading8 local records +
01Housing baseline
500 occupied private dwellings were reported as row houses in the 2021 Census profile (54%); 235 single-detached houses represented another 25%. For this monthly market reading, use that evidence to define which property segment a monthly statistic could reasonably describe. Read it beside: Review the current title and applicable registered instruments, easements, caveats, liens, encumbrances and plans with qualified legal advice. Comparison checkpoint: Glamorgan. Compare a nearby established southwest community with a wider mix of detached, attached and condominium choices. Current listing status still belongs to the approved live record.
02Seller positioning
Lead with the real differentiators of the Rutland Park property: site, effective age, documented improvements, layout, ownership structure and immediate setting. Applied to the monthly market reading, the evidence helps separate the fixed housing baseline from current listing and sales activity. Read it beside: Address-level permits, land use and planning records. Publisher record: The City of Calgary. Comparison checkpoint: Richmond. Compare an inner-city alternative where infill activity, lot value and access routes may carry more weight in the purchase decision. Condition and legality still require the documents and review appropriate to the property.
03Community identity
The profile counted 2,140 people in private households across 930 households, with an average household size of 2.3 people. Within the monthly market reading, its job is to identify which subject-property differences could make a community headline misleading. Read it beside: Compare the immediately adjacent community for differences in condominium supply, institutional edge conditions and ownership costs. Comparison checkpoint: Lincoln Park. Compare the immediately adjacent community for differences in condominium supply, institutional edge conditions and ownership costs. A lender or mortgage professional must decide how the actual property affects financing acceptance.
04Property review
Identify address-specific water, drainage, slope, noise, traffic, construction, fire, environmental or insurance questions relevant to the Rutland Park property; do not generalize an exposure to every home. The monthly market reading should use this record to keep price positioning connected to the home's actual site, condition and alternatives. Read it beside: Avoid freezing tenant lists or opening dates into evergreen copy; link to the live source where that detail matters. Comparison checkpoint: Currie Barracks. Compare newer master-planned housing and redevelopment context against Rutland Park's established homes and row-housing options. Community context cannot establish value for the subject home.
052021 Census Community Profile: Rutland Park
Census population, household, tenure, dwelling-form and construction-period context. Publisher record: The City of Calgary. Here, the practical use is to record the required geography, period, definition and source before publishing a number. Read it beside: Test current routes, schools, services and amenities from the exact address at relevant times rather than relying on a fixed travel claim. Comparison checkpoint: Glamorgan. Compare a nearby established southwest community with a wider mix of detached, attached and condominium choices. A named source supports only the claim and geography recorded for it.
06Compare Lincoln Park
Compare the immediately adjacent community for differences in condominium supply, institutional edge conditions and ownership costs. Carry this into the monthly market reading to test whether a nearby comparison area belongs in the same buyer alternative set. Read it beside: Semi-detached house: 30 occupied private dwellings (3%) in the 2021 Census profile. Comparison checkpoint: Richmond. Compare an inner-city alternative where infill activity, lot value and access routes may carry more weight in the purchase decision. A comparison relationship does not make two properties or communities equivalent.
07Mobility and daily context
565 residents aged five and older had moved within the prior five years (28%); that is household-mobility context rather than a proxy for real estate turnover. For the monthly market reading workflow, use it to keep daily-life appeal outside the calculation unless current evidence supports the connection. Read it beside: Coordinate photography, floor plans, video, mapping, listing copy, search pages, team distribution and inquiry follow-up around one accurate property narrative. Comparison checkpoint: Lincoln Park. Compare the immediately adjacent community for differences in condominium supply, institutional edge conditions and ownership costs. Historical evidence must not be presented as current inventory or operating status.
08Buyer decision
Which Rutland Park property form, ownership structure and completion stage fit the intended use and budget? The next step in the monthly market reading is to turn the series into a property question rather than a prediction of value. Read it beside: The profile counted 2,140 people in private households across 930 households, with an average household size of 2.3 people. Comparison checkpoint: Currie Barracks. Compare newer master-planned housing and redevelopment context against Rutland Park's established homes and row-housing options. The paired records define the next question; they do not settle the property conclusion.
Explore the guides
Choose your next step in Rutland Park.
Compare the community, the type of home and the property-specific details in the order that makes sense for your move.
01
Know the underlying stock
Put monthly activity beside Rutland Park's dated dwelling-form and construction-period context.
Explore →02Infill guide
Use the infill guide to understand why unlike properties can move differently inside one reporting period.
Explore →03Apply the series to one property
Build a launch recommendation from the subject home and its current alternatives—not from one community headline.
Explore →Quick answers
What buyers and sellers ask about Rutland Park.
Start with the practical questions, then open the detailed guide that matches the property or decision in front of you.
Are the Rutland Park market numbers on this page current?
separate monthly source, geography and resource verification required.
How should a Rutland Park market report be interpreted?
500 occupied private dwellings were reported as row houses in the 2021 Census profile (54%); 235 single-detached houses represented another 25%. Keep property type, source geography, period and underlying counts visible before applying a rate or benchmark to one home.
Why are missing Rutland Park market values left blank?
A blank protects the geography and methodology. The site does not replace a missing community value with a Calgary-wide figure, estimate or inferred number.
Can a community benchmark price a specific Rutland Park home?
No. A community statistic supplies context; site, effective age, condition, finish, documents and current alternatives determine how a subject property relates to that context.
Official referencesGovernment and official records used for local context3 references +
01Municipal property assessmentGovernment of Alberta · accessed 2026-09-12
Provincial context for municipal property assessment and its distinction from a property-specific market opinion
Open official source ↗022021 Census Community Profile: Rutland ParkThe City of Calgary · accessed 2026-08-26Census population, household, tenure, dwelling-form and construction-period context
Open official source ↗03Find land titles, documents or plansGovernment of Alberta · accessed 2026-08-26Title, registered-interest and plan due diligence
Open official source ↗Official records provide dated community context. Current listing status and conclusions about one property still require the applicable live record and property documents.